2023 Q3 Review and Outlook – The Bear Steepener
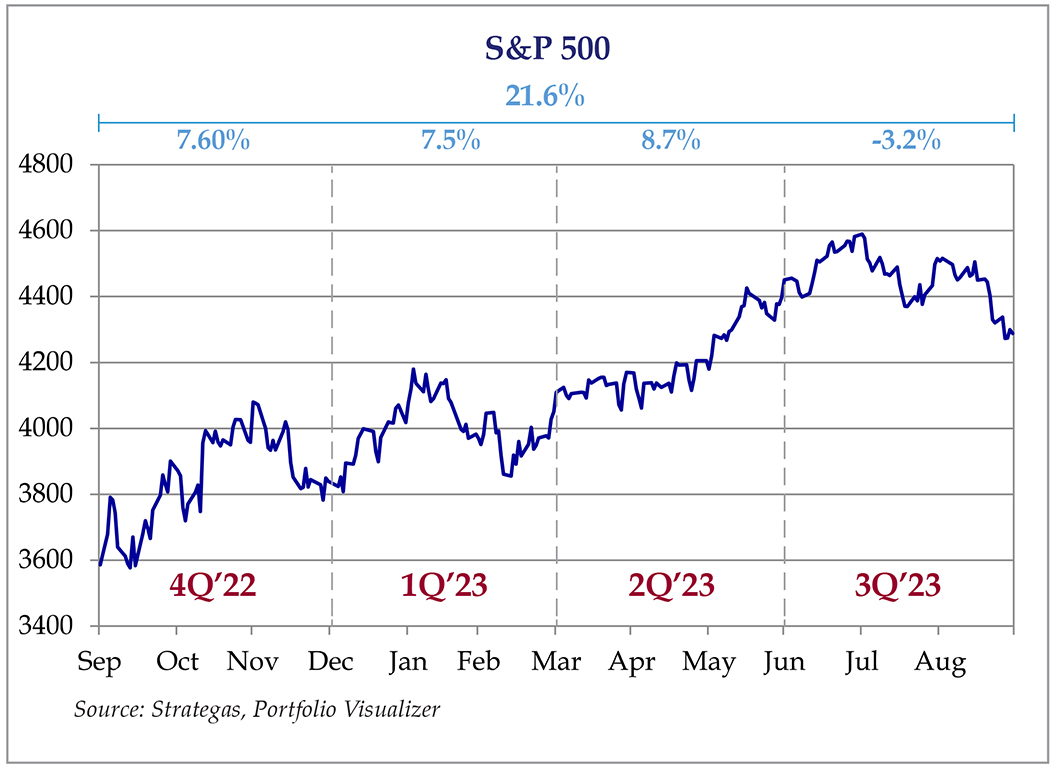
Markets took a step back in the third quarter as stocks (as measured by the S&P 500 SPDR ETF – SPY) lost 3.2%. The U.S. bond market (as measured by the US Aggregate Bond ETF – AGG) also lost 3.2%, and a 60% stock/40% bond portfolio lost 3.2%. (Yes, you read that correctly – stocks and bonds had identical returns for the quarter.) Year-to-date (YTD), stocks returned 13.0%, bonds declined 1.0% and a 60/40 portfolio gained 7.4%.
Figure 1: S&P 500 quarterly performance, trailing four quarters.
Interest rates take another turn upward
We want our readers to learn more about finance and investing, and, in this issue, we can even help you sound like an “investment guru” to your friends and family! When you are handing out Halloween candy with the other parents or enjoying a post-golf beer in the clubhouse with your foursome and someone brings up the economy or how their stock portfolio is doing, you can shake your head soberly, and say, “yeah, that bear steepener on the yield curve is really shaking things up.”
You might be wondering what on earth “bear steepener” means. It is a term used by bond traders to describe the relationship between short-term and long-term interest rates – specifically how that relationship changes over time.
As we discussed in previous updates, investors generally demand higher yields for longer term bonds relative to short term bonds (or cash/money market funds). It makes sense because your long-term bond investment is locked up for a longer period. A lot more can happen to the world over the next ten years vs. the next year or two.
However, sometimes the yield curve “inverts” and short-term yields exceed longer term yields. This is usually a signal that something is wrong with either the financial markets or the economy or both, and an inverted yield curve has preceded every recession over the past 50 years. We have had an inverted yield curve for over a year.
If longer-term bond investors accept lower yields than shorter term investors, it is for two primary reasons: 1) The Fed is going to cut interest rates in the future because the economy slows; and/or 2) Inflation will be much lower in the future. While we could get the “goldilocks”/”soft landing” scenario of a rekindled economy with low inflation, there is the possibility that lower future inflation (which is implied by lower long term bond yields) means a stagnant economy (i.e., lots of unemployed people not buying stuff implies lower inflation).
Now the yield curve is slowly un-inverting (i.e., “steepening”) – but we still aren’t in a recession (despite a majority of economists predicting a recession over the past year.) As Figure 2 shows, a 1-year treasury bond yielded about 5.4% at the beginning of the quarter, but the 10-year bond only had a 3.85% yield. At the end of the quarter, the 1-year yield remained at 5.4-5.5%, but the 10-year yield climbed to almost 4.6%. That is a very large increase for one quarter, and most of our clients’ bond portfolios felt the pinch, as bond prices go down when bond yields go up. This is why it’s called a “bear steepener” – the yield curve is steepening, and yields are going up (which means bond prices are going down, hence the “bear.”) A “bull steepener” would mean that longer term yields stay the same (or fall slightly), while short-term yields fall.
Figure 2: Change in the U.S. Treasury Bond Yield Curve, 3Q2023
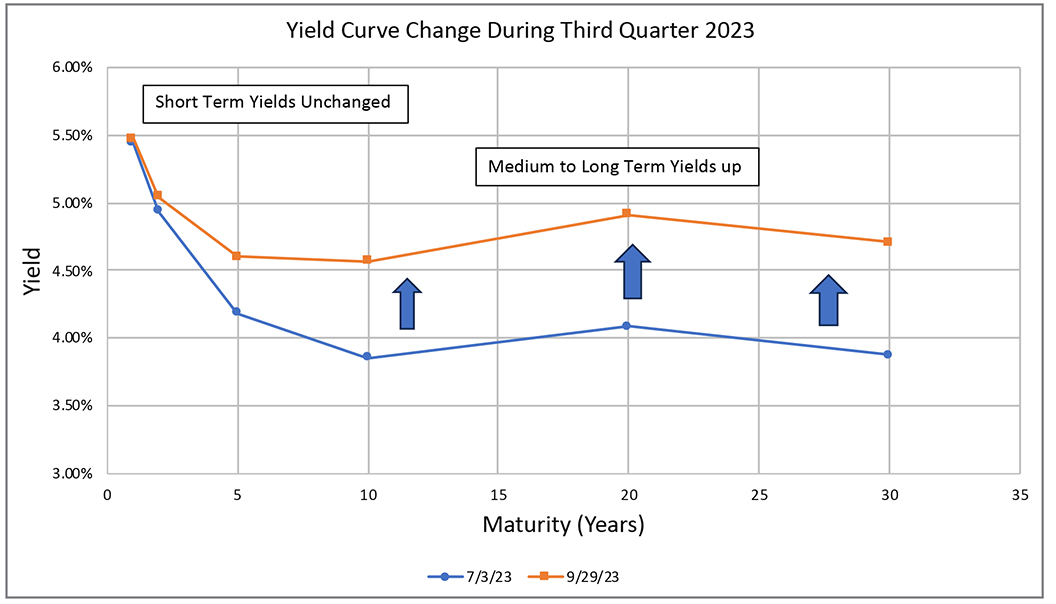
Source: Koyfin
Now that we are all going to sound smart at our next cocktail party, what does that mean for the economy and the markets? What are bond investors trying to tell us? Normally, a steepening yield curve implies a more optimistic outlook for the economy, as bond investors expect some combination of higher inflation (from higher economic activity) and no Federal Reserve rate cuts (due to a stronger economy and/or higher inflation).
However, the economy is still slowing, and the recent increase in long-term rates was quite sudden. This has also driven mortgage rates to 7.5%-8% and auto loans to 6.5%-7%. Existing home sales have ground to a halt, as people sitting on 3%-4% mortgages are only moving if they absolutely must, and the few homes that are on the market are becoming unaffordable to new home buyers. The only source of supply is new homes, because a) they are the only houses for sale in large numbers and b) some of the bigger homebuilders are subsidizing buyers’ mortgage rates.
Higher long-term rates also slow the business side of the economy. There are a lot of mortgages on half-empty office buildings coming due, and many of these landlords can’t afford to refinance at the higher rates. Higher rates for corporate bonds and bank loans will also increase the cost of capital, leading to fewer investments in new plants and R&D. Lower profits (from higher interest costs) also mean cost-cutting which could results in layoffs and higher unemployment.
And, the elephant (or donkey) in the room is that the government has to find a way to pay these higher interest rates to treasury bond holders. There are a variety of ways to find the cash to pay higher bond yields and none of them are pleasant – 1) increase taxes, 2) decrease spending on other things, 3) issue more debt, or 4) print money. #4 ensures that treasury bonds will be repaid, but this scenario begs the question of “how much will that money be worth?” if the government is literally printing interest and principal payments out of thin air.
To summarize, a steepening yield curve at this point in time isn’t providing the usual sunny signal – although it certainly leaves room for favorable scenarios. We believe instead that it highlights the very fine balance between the opposing forces of inflation and the economy (and the Fed, which is still committed to crushing inflation, even at the cost of a recession).
Inflation – still oozing downward
Speaking of inflation, the growth rate of the Consumer Price Index (CPI) continues to ooze downward at a “cold molasses” pace. In past reviews, we expected continued improvement in the inflation numbers, owing to a) a tightening Federal Reserve and b) a decline in the money supply from more conservative banks with increasing funding costs and higher defaults. Less money + more “stuff” = lower prices (all else equal!) Based on the September Consumer Price Index (CPI) report (released on October 12th), the inflation trend is still favorable, but it’s taking its time.
The CPI rose by 3.7% from September 2022 to September 2023. This was roughly in line with economists’ expectations but higher than the 3.0% rate last quarter, as energy prices rebounded and went from a positive (i.e., negative growth) to a more neutral (0% growth) effect.
Last quarter, the “core” measure of inflation (which excludes food and energy and includes 80% of the CPI) remained stubbornly high at 4.8% year-over-year growth. This quarter, it dropped to 4.1%. While this number is still higher than the headline number and much higher than the Federal Reserve’s 2.0% goal the trend remains encouraging.
The Economy is teetering on the edge – but still no recession
According to a Wall Street Journal economists survey, exactly 50% of economists forecast a recession. Notably, the 50% is down from over 60% near the beginning of this year, so the “soft landing” bells are tolling a bit more loudly.
There hasn’t been a lot of movement in the major economic indicators over the past three months, but any movement has mostly been in the downward direction. Most of the “stuff” indicators such as freight rates, railroad volumes, the purchasing managers’ survey, the Empire State manufacturing survey and many others have been weak and getting steadily weaker.
Meanwhile, the “people” indicators such as unemployment, wages, travel, restaurants, etc. continue to hold up much better. Since consumer spending is the largest category of Gross Domestic Product (GDP – the ultimate recession measure), consumers are holding the economy’s head above water.
However, 8% mortgages and 6% car loans (and a re-start of suspended student loan payments) aren’t doing consumers any favors, and the excess savings from the COVID stimulus payments is almost spent. Also, while the Fed may have “paused,” Chairman Jerome Powell has been very clear about his determination to crush inflation at almost any cost.
The “Magnificent Seven” are Cooling Off
In last quarter’s update we highlighted the furious rally staged by some of the largest technology companies, which acquired the catchy if uncreative name “The Magnificent Seven.” The seven stocks are Apple, Microsoft, Alphabet (Google), Amazon, NVIDIA, Meta (Facebook) and Tesla and they not only crushed the performance of every index, but also distorted the performance of huge “diversified” indices such as the S&P 500 and the NASDAQ 100. The “average stock” (as measured by an equal-weighted index) just stood still and watched the fireworks.
However, as Figure 3 shows below, these seven hot stocks cooled down in the third quarter. While they slightly outperformed the major indices, the difference wasn’t significant.
There are many reasons for the return to earth – higher interest rates (discussed above) is the primary explanation, as most of these seven stocks don’t pay dividends. As bonds become more attractive, “growthier” low dividend stock investors are in theory less willing to wait for those dividends, all else equal. That theory is overly simplistic, however – it could simply mean that the crazy momentum traders simply moved on to the next shiny objects.
The lesson here isn’t that the Magnificent Seven are bad companies or poor investments. They are all very strong businesses with bright futures ahead of them (and we directly own Apple, Microsoft and Amazon and indirectly own Alphabet and Meta in our client portfolios.) However, sometimes the hype can get ahead of the actual results, and short-term traders/investors who chase these hot stocks and/or trends (e.g., Artificial Intelligence) can often wind up chasing their own tails.
Figure 3: “Magnificent Seven,” 3Q23 vs. 2Q23 returns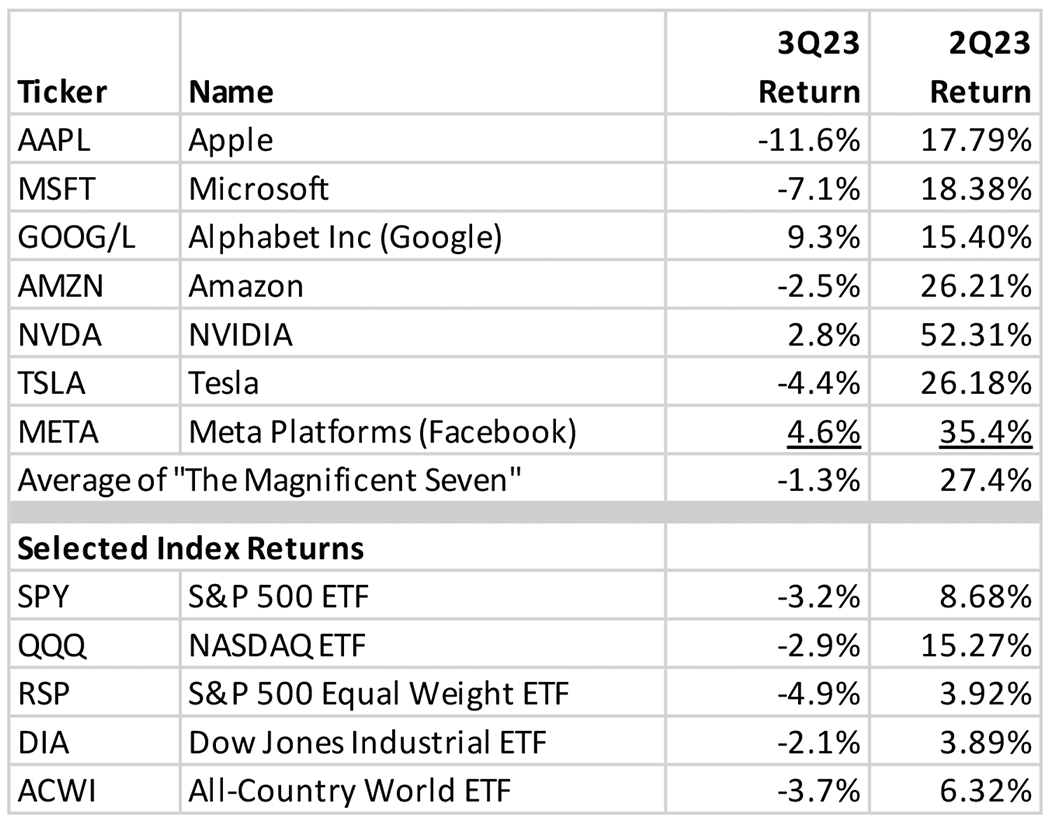
Source: Koyfin
War in the Middle East
War is back in the Middle East. While the trigger was pulled after the quarter was over, we would be remiss if we didn’t comment on the matter – especially its potential effects on the rest of the world. On October 7th, forces organized by Hamas broke out of the Gaza Strip and invaded the Israeli towns nearby in a horrific attack that resulted in over 1,400 civilian deaths and hostages. Predictably, the Israeli Defense Force (IDF) has responded in kind, with extensive bombing and an imminent invasion of the Gaza Strip. Other than acknowledging the sheer horror of the situation, we won’t directly comment on the ongoing war from a political or military sense, as that is far above our pay grade.
However, we did watch the market reaction following the attack (and the counterattack in response to the initial attack) and financial markets…yawned. Usually, the initial instinct at the outbreak of war in the Middle East is “sell stocks, buy treasury bonds and buy oil.” From 10/9 to 10/16, the U.S. Stock Market Index (VTI) is up 0.91%, oil (USO) is up 1.4% and long-term treasury bonds are down 0.71% – which are all well within the “noise” range of a week’s trading. This hypothetical “war trader” is only one for three so far, despite a clear potential of this conflict to expand beyond Israel to Iran, Lebanon and even Russia and Saudi Arabia.
This is not meant to minimize the truly horrible human cost of the latest chapter of the thousand-year war in this region. However, as we mentioned last quarter (and will continue to emphasize to our clients and anybody willing to listen), short-term forecasts are effectively impossible, so we remain committed to the boring principles of a) having a solid financial plan (and asset allocation to match the plan); b) broad diversification; and c) investing in high quality companies.
We hope everyone enjoys the Autumn leaves and football, and please contact us if you have any questions.