2026 Q3 Review and Outlook – When average isn’t good enough
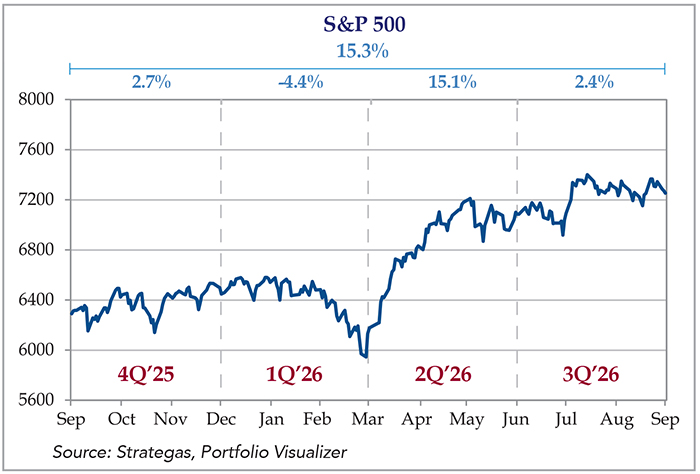
After a huge second quarter, the market moderated its pace as stocks (as measured by the S&P 500 SPDR ETF – SPY) increased “only” 2.4% in 3Q26. The U.S. bond market (as measured by the US Aggregate Bond ETF – AGG) declined 3.5% on the back of sharp increases in interest rates (more on that later) and a 60% stock/40% bond portfolio was flat. Year to date, stocks are up 12.7%, bonds down 2.8% and a 60/40 portfolio gained 6.5%.
Figure 1: S&P 500 quarterly performance, trailing four quarters.
When “average” isn’t good enough
The stock market’s behavior in the third quarter and first 9 months of 2026 has been odd, in several ways. The major indexes – particularly the popular S&P 500 – keep pushing higher amidst two wars, high oil prices, rising interest rates and stubborn inflation. However, there is a lot of action under the surface, as the “breadth” of this advance has become narrower as the year progressed. By the time we hit September, “big tech” seemed to be the only game in town. Fortunately for holders of S&P 500 index funds, the bigger stocks contributed more to the index’s return than the smaller ones, and big tech has grown like the plant in Little Shop of Horrors, taking up more and more of the index every quarter.
The story has been much different for the “average” stock – especially in more boring sectors such as finance, industrials, utilities, etc. Despite continuing to produce profits, they have mostly been left behind by investors wanting to join the rush to build and equip data centers around the world to feed the A.I. beast.
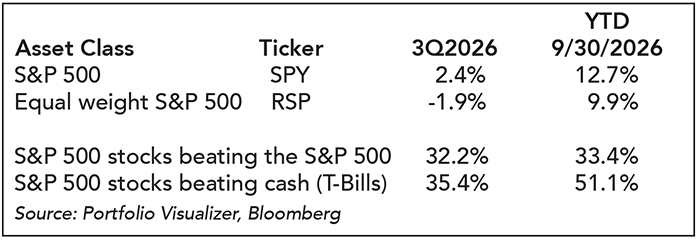
As a result, the “average stock” was down in the third quarter in an “up” market. Fewer than one-third of stocks in the S&P 500 outperformed the S&P 500 during the third quarter of 2026 and only 35% outperformed cash (i.e. T-Bills). The numbers were only slightly better for the first 9 months of the year – 33% outperformed the S&P 500 and 51% outperformed cash (when the market is up almost 13%). The following chart summarizes the numbers:
Figure 2: Total Returns/Stocks outperforming the S&P 500
As a result, many investors (including our clients) may get a surprise when checking their brokerage accounts and find they are down for the quarter and well behind the S&P 500 for the year. Very few investors solely stick to broad market index funds for 100% of their investment assets and hold a lot of “average stocks.” Meanwhile, their tech-nerd neighbor with the ChatGPT Pro subscription and “diversified” portfolio of NVIDIA, Micron, Taiwan Semiconductor and Sandisk is looking like a genius.
You may even own all the big names – NVIDIA, Microsoft, Apple, etc. and still underperform, because it is becoming hard to own as much big tech as the S&P 500 owns without compromising basic diversification rules. We lean toward the more truly diversified investor (while still owning a bunch of tech stocks) and our portfolios look more like the equal-weight S&P 500 than the standard market-cap weight index. This almost guarantees that we lag the indexes in “narrow” market (such as the past 3-5 years) but hold up very well in a more “normal” market, where the “average” stock is…average.
As it turns out, the first three weeks of October completely reversed the year-to-date trend, with technology stocks plunging and the more defensive stocks rallying. While we believe that the technology sector will do very well over a long time horizon, there are a lot of great companies in non-tech sectors that will also make investors happy. Volatility goes in both directions, and filling up your portfolio with tech can be very painful in a downturn (see 2022).
Interest rates jump – higher inflation fears, or higher growth expectations?
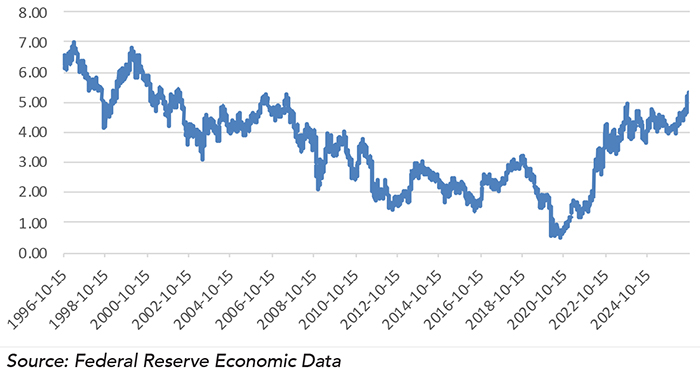
One long-suffering asset class that is finally getting attention is bonds. Boring old bonds made the headlines as interest rates spiked across the board, and the 10-year treasury bond yield broke above the 5% mark for the first time in almost 20 years, as the following chart shows.
Figure 3: 10 year Treasury Bond Yield
This is a classic “glass is half empty or half full” situation. On one hand, bond yields have been very low relative to historical averages for 20 years, which has resulted in disappointing returns for bond investors and another reason for “Mr. Tech Stocks” to gloat at the backyard barbeque. However, a 5% guaranteed return for 10 years is starting to look interesting against a 8%-10% “possible but absolutely not guaranteed” return for stocks over a similar time horizon. Even if you take higher inflation into account, you could still end up with a nice “real” return at the end of the 10 year period (5%-3% inflation = 2% after inflation return). Plus, if you want to take a bit more risk, investment-grade corporate bond yields have exceeded 6% in some cases.
This is very encouraging for investors who have a blended portfolio of stocks and bonds (e.g., 60% stocks/40% bonds) and have relied on the riskier stock portfolio to provide the lion’s share of the overall return over the past 5-10 years. Now, bonds are no longer just a “stabilizer” for the portfolio and are starting to contribute meaningfully to overall returns.
However, the rapid rise in rates may be sending a cautionary message about the future economy. Since bond returns are locked in at the time of purchase (you only get 5% per year, no more, no less), inflation is a bond investor’s biggest fear. When yields jump in a short period of time, it could mean that investors believe that inflation is going to be “higher for longer,” and nobody wants that. Also, higher treasury bond yields mean higher mortgage rates (which just crossed back above 7%), which lowers housing affordability and reduces home construction and related economic activity.
That’s not the only message, though. Higher long-term yields can also signal expectations of stronger economic growth, because bonds are competing with stocks for the investor’s dollar, and expectations for higher growth mean a higher bar for “safe” returns, since risk-taking is increasing.
Also, existing bond portfolios will lose value, since bond prices fall when interest rates rise. If you paid $100 for a 10 year treasury bond that yielded 4%, and now people can pay the same $100 for a treasury bond that yields 5%, you would have to discount the price of your bond if you want to sell it, because who would pay full price for a 4% bond? However, if you hold your 4% bond to maturity, you will still get your full 4%. Since accounting rules require us to mark everything to market values, so you will most likely see “losses” in your bond portfolio for the quarter.
With all that said, 5% isn’t too shabby, and people who need a little stability in their portfolios may find these yields attractive.
THE DEBT
BUT WHAT ABOUT THE DEBT scream the hysterical investors who recently read about the $40 Trillion of debt owed by the federal government. $40 trillion is a lot of money! The federal debt has been a thorny issue in the investing world and a political football for decades. We have had countless federal government shutdowns over the budget and debates about the “debt ceiling,” and CNBC commentators can always pull “the debt” out of their back pockets on a slow news day to spice up the morning show. People who want to sell you gold coins or cryptocurrency love talking about “the debt.”
Unfortunately, it is difficult to have a nuanced conversation about “the debt,” because nuance doesn’t get clicks and ratings. Yes, there can be severe consequences from mismanaging debt. But debt itself isn’t bad. It is a perfectly acceptable way to fund an economic venture. We get a car loan to buy a car so we can drive to our job and make more money. A corporation will issue debt to build a factory (or a data center!) that helps grow its profits without needing to take on new investors. A government issues debt to build roads, maintain its military, provide services to the poor, etc. All these uses can potentially grow the economy.
What about a “default” scenario? Won’t that cause a widespread societal collapse? If a person doesn’t pay the car loan, the car gets repossessed by the bank. If a corporation defaults on its debt, the debtors get ownership of the company (or what’s left of it). If the federal government defaults…well, the United States government cannot default on its debt, because it can and will print money to pay back bondholders. So, the doomsday scenario of a government debt default isn’t going to happen.
However, printing money to pay off debt isn’t great for the economy, as it would trigger a wave of inflation. You will get your principal and interest payments, but the money you get will be worth a lot less than when you originally bought that treasury bond. This is probably the most realistic risk from unmanageable debt levels, since rising inflation would lead to rising interest rates, which would further worsen the debt situation, and so on. We don’t want to be in that spot.
The trick is to figure out what “unmanageable” means, and the correct way to approach it isn’t looking at a dollar amount, but the relationship to the size of the economy. A doctor or lawyer making $500,000/year can support a lot more debt than a college graduate making $75,000/year. Corporate giants such as Microsoft or NVIDIA can support debt levels that would bury even the most profitable small-cap company. As the largest economy in the world, the United States can support more debt than any other country.
However, the ratio of debt to the size of the economy (Gross Domestic Product, or GDP) has increased sharply since COVID and is now greater than 100% of GDP, which is higher than any period since World War II. That is concerning, but not panic-inducing, as other countries such as Japan have effectively managed much higher debt burdens for years, and China isn’t too far behind us.
This implies an “exit strategy” – if we can grow the economy faster than the interest rate on the debt, this ratio will shrink – without Congress cutting spending by a penny. With a 5% 10-year treasury yield and 3% inflation, real GDP growth needs to exceed 2%, and this is do-able. Treasury Secretary Scott Bessent said as much in a recent news conference and wants 3% growth (hopefully with the help of A.I. to contribute that extra percentage point.)
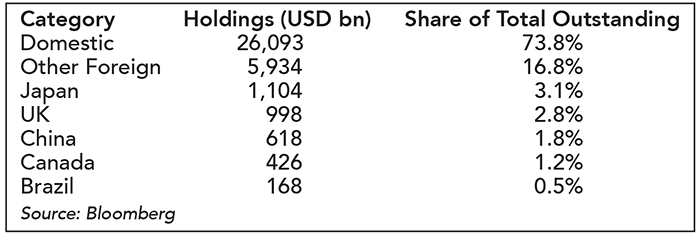
Speaking of China, there is also a stubborn myth that “China holds our debt and can bankrupt us just by dumping it.” That is far from the truth, as China “dumped” our debt years ago, and nobody noticed. The following chart shows the countries that hold our treasury bonds.
Figure 4: Share of total U.S. Treasury Bonds
So yes, “the debt” has reached a very high point in both dollar terms and as a percent of the economy, and we believe it is concerning – but not an impending catastrophe. The largest economy in the world will always have a lot of debt, and that isn’t inherently bad. We do need to manage it properly, however, or inflation will stick around for a lot longer than we would like.
Inflation: Stubbornly high
September’s recent inflation report told a similar story as the last few months, as the total CPI grew at a 3.72% year-over-year rate (manly due to war-driven oil price changes) and the Core CPI (i.e., not counting food and energy) increased 2.57%, which is much lower than the headline number, but still above the 2% target. However, both numbers were higher than forecast, which creates a concern that getting back to 2% will take longer than expected. Of course, it will be impossible to hit the overall inflation goals as long as war continues in the Persian Gulf, which should continue to put upward pressure on energy prices.
The upside surprise in the latest CPI report as well as an equally “hot” Producer Price Index (which measures inputs to the production process – if cars are in the CPI, steel prices would be in the PPI) has put expectations of rate cuts on hold, with speculation focusing on a possible increase to short-term rates. This puts Fed Chairman Kevin Warsh in a tight spot, considering the upcoming mid-term elections. We believe that inflation will continue with the current pattern until the war with Iran ends, which means that the Fed is going to move slowly and cautiously.
As usual, we don’t try to forecast every zig and zag of inflation or interest rates, and there will always be sectors that are the heroes for a while, then become the goats. A solid financial plan backed by an appropriate asset allocation in a diversified portfolio is our preferred approach to investment strategy. Not exciting, but effective!
Enjoy the Autumn leaves and football games and we will see you in the new year with the next update. Please contact us if you have any questions.