2026 Q2 Review and Outlook – The Expectations Game
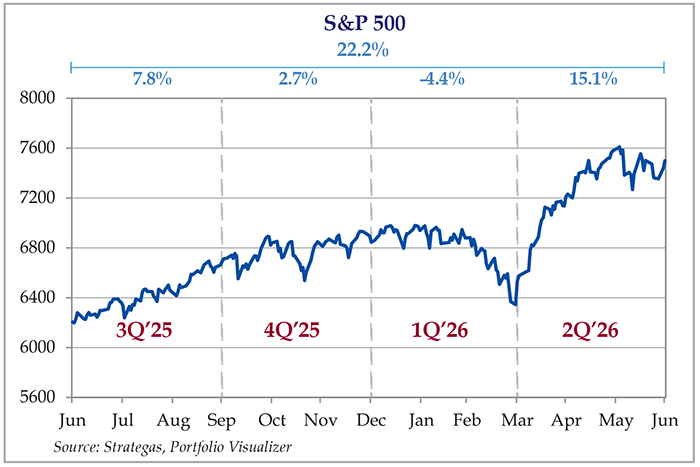
The market shrugged off a weak first quarter as stocks (as measured by the S&P 500 SPDR ETF – SPY) increased 15.1% in 2Q26 (which would be considered an amazing annual return). The U.S. bond market (as measured by the US Aggregate Bond ETF – AGG) was up 0.7%, and a 60% stock/40% bond portfolio earned a 9.4% total return. Year to date, stocks are up 10.1%, bonds 0.7% and a 60/40 portfolio 6.4%.
Figure 1: S&P 500 quarterly performance, trailing four quarters.
The Expectations Game – Concentrating profits, broadening performance
One of the many infuriating aspects of investing is that short-term performance is driven by expectations of longer-term performance. For example, stock prices reliably track profits and dividends over 10 and 20 year periods. However, profit growth in any given year is no guarantee of stock price growth. Instead, mass psychology takes over as investors try to read the tea leaves of every quarterly report and compare the results to what Wall Street expects. So, a 100% increase in profits could result in the stock dropping 10% the next morning because investors expected 110% growth. Or, the results beat expectations, but the CEO wasn’t doing happy cartwheels on the quarterly conference call. There are even A.I. programs that analyze management’s commentary to detect a positive or negative tone and will buy or sell accordingly.
With the massive amount money pouring into artificial intelligence related investments, the expectations game keeps raising the bar every quarter – particularly with the hardware companies supplying the data centers. As a result, according to research firm Strategas, about 40% of the S&P 500’s expected net income growth for the second quarter is driven by two stocks. Two. Micron Technologies (MU) and NVIDIA (NVDA). The top 20 contributors (which also include some energy stocks) account for 95% of the expected S&P 500 profit growth. The technology sector alone accounts for 61% of the expected growth.
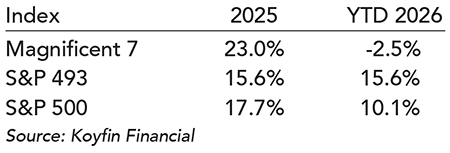
As a result of these fantastic growth expectations, the “Magnificent 7” stocks (NVIDIA, Microsoft, Apple, Amazon, Meta, Alphabet and Tesla) are…down 2.5% year to date, while the S&P 500 without the Mag 7 (“the S&P 493”) is up 15.6% year to date and the S&P 500 is up 10.1% (Figure 2 below). To be fair, the technology sector is up 33% YTD, although that is also due to an increasingly small group of companies – mainly hardware and semiconductor manufacturers – taking the lion’s share of the growth. (The Semiconductor index is up 82%.)
Figure 2: Magnificent 7 vs. “S&P 493” total return
This also reflects a slow shift in the investment patterns of the technology world, where the big tech stalwarts such as Microsoft and Google go from cash gushing machines to cash consuming machines, as they invest hundreds of billions of dollars into A.I. data centers to compete with the relatively new OpenAI, Anthropic, Perplexity, GrokAI etc., who are spending equally huge amounts of money building their own data centers – coming to a backyard near you!
As an example, a 500MW A.I. data center costs between $30 billion and $40 billion to build and equip with servers and network equipment. There are hundreds of data centers currently under construction or in the permitting process. Not only does this take inconceivable amounts of new capital to build, but the providers of the capital need a return on these trillions of dollars. Unfortunately, the path to profits is as clear as mud. As a result, the perception of these blue-chip tech stocks has shifted to a more cautious stance.
Meanwhile, there are a lot of very profitable non-AI companies that have been ignored and are now getting attention from investors. A lot of these companies could get a lot of benefit from using A.I., but won’t need to sink all of that cash into datacenters and NVIDIA processors. Maybe their expectations have been too low and are now being recalibrated. It’s a never-ending process.
The Expectations Game – Part 2 (Hardware vs. Software)
In last quarter’s report we highlighted the extensive damage done to software and “software-adjacent” stocks from a single blog post that described a hypothetical “A.I. apocalypse” just a few years from now. The average software stock dropped about 25% in just three months, while “A.I. vulnerable” industries (business services, asset management) were also down 20% to 40% in the same period. Note that these are all highly profitable companies that are still growing, but this is another example of crowd psychology and expectations overwhelming current fundamentals in short time periods.
But, as we have said many times in the past, the market is pretty smart, many times moving ahead of major changes in the economy or world events (or Trump tweets.) While you shouldn’t make drastic moves based on a few months of stock performance, it is wise to sit up and pay more attention. Even if the blogger’s grim forecast doesn’t pan out 100%, he may still be right in a few places.
As a result, we updated last quarter’s “A.I. targets vs. beneficiaries” chart with 2Q26’s and, importantly, the third quarter to date performance numbers in Figure 3 below.
Figure 3: Returns for selected “A.I. targets” and A.I. beneficiaries
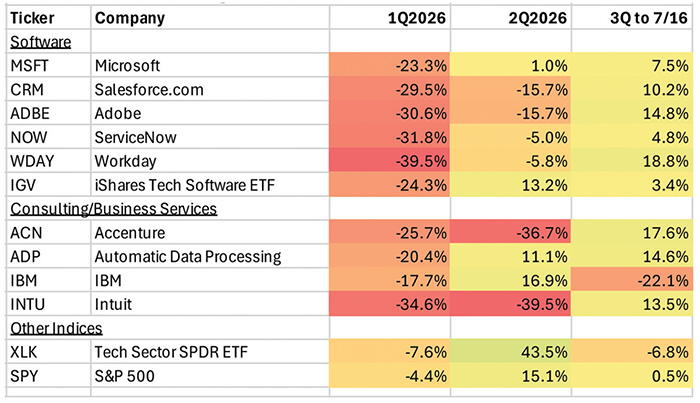
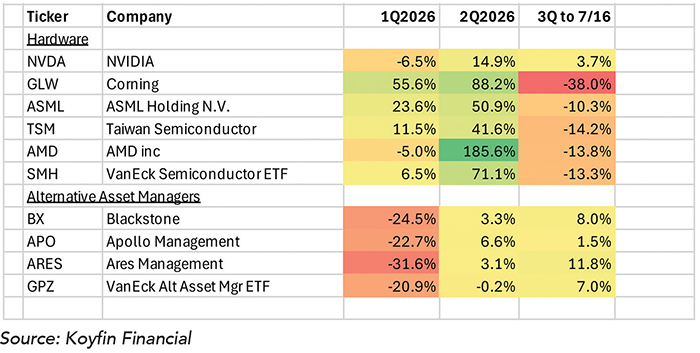
The general trend continued into the second quarter, with most software companies continuing to fall while the hardware and networking companies (selling “picks and shovels” during the gold rush) made huge runs. However, the picture looks a little different in July. Software and business services stocks found some buyers while the hardware companies dropped like rocks, even though hardware-related profit estimates continue to be revised upward.
We urge you to take these numbers with a grain of silicon, as two weeks doesn’t make a year, and two quarters don’t make ten years. Again, stocks are long-term, muti-decade assets which are treated like Pokemon cards or Beanie Babies on a day-to-day and month to month basis. The short-term stock price volatility is the market constantly trying to find equilibrium – that “fair” price for everything that will never be found. Software companies remain vulnerable to A.I., and hardware companies remain vulnerable to the slightest slowdown in spending by the A.I. companies. We own several stocks on both sides of this chart and accept the ups and downs in any given year, relying on strong management teams to figure out the best path forward. However, if we do believe that some of these big changes are going to stick, then we adjust the portfolio as necessary.
The Expectations Game – Part 3 (SpaceX)
Another major event of the second quarter was the largest Initial Public Offering (IPO) in history – Space Exploration Technologies, Inc. (aka SpaceX). This is the other half of Elon Musk’s empire which has extremely ambitious plans that stretch literally to Mars.
A hot IPO is a perfect laboratory of short-term vs. long-term and expectations vs. reality, as a) SpaceX has probably one of the longest investment horizons of any stock; b) it is currently losing billions of dollars ($5 billion in 2025); and c) it is run by a CEO who seems to be good at accomplishing impossible tasks.
The CEO in question is the richest man in the world by a wide margin. Aside from being a brilliant person with a maniacal work ethic, he is also very good at gaming the system to his advantage. In this case, he set up the IPO for maximum short-term results. First, he only sold a relatively small number of shares which limited the supply available to buy. Second, he lobbied the NASDAQ to modify its inclusion rules, which means index funds that track the NASDAQ are forced buyers after inclusion. (The S&P 500 wouldn’t back down from its own rules and is going to wait a full year for inclusion). The stock joined the NASDAQ 100 on July 7th, which means owners of the QQQ ETF will eventually own SPCX stock. Since it will only be weighted on the value of its tradable shares (the “float”) its weighting will probably be in the 1% range. However, that is still a lot of buying, and just the expectation of forced buying further increased the hype of the IPO.
How did it go? It went great…for the first three days. The stock quickly rose from the $150 opening day price (up from the official $135 IPO price) to as high as $225. However, it turned over and fell and fell some more and is currently trading about $124 – 17% below the first traded price and 45% below the high point. We have no idea what the stock is going to do – it is completely at the mercy of the investing public for the foreseeable future. It may completely change the world with its Mars missions, datacenters in space and superhuman A.I., but it is unclear how profitable any of this will be, and profitability is what drives long-term returns. It will take years just to reach break-even. But, if you are truly committed to a multi-decade time horizon, maybe put some shares in a box and put the box on the shelf, to be opened by your kids (or grandkids). For shorter holding periods, it might be better to go to a casino.
The Expectations Game – Part 4 (War in Iran)
The last update on what investors expect (or fear) vs. what actually happens involves the continuing war in Iran and the Strait of Hormuz. Wars are generally bad events that cause loss of life and general chaos, which often leak into the world economy. However, wars have historically been neither good nor bad for the stock market, which we discussed at length in the previous quarter’s report.
Furthermore, buying what “should” go up and selling what “should” go down in a war is not always a recipe for success. We updated the “Epic Fury trades” from last quarter to reflect returns up until July 16th. As Figure 4 shows, the strategy of “buy energy, defense and gold and sell everything else” still hasn’t worked.
Figure 4: Epic Fury Trades: 2/28/2026 to 7/16/2026
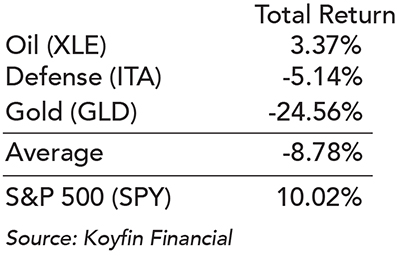
None of these investments are necessarily “bad.” You can make a case for owning all of them. However, the trends you want to capture aren’t contained in a single war, but the future wars and peace and high and low oil prices and strong and weak economies over many years.
Inflation: Mixed message
July’s recent inflation report was warmly received by investors, as the CPI was down slightly from June (mostly reflecting a drop in oil prices) and the Core CPI was basically flat vs. last month on the heels of slowing services price growth. Year-over-year, the Core CPI increased 2.59%, which was also lower than expectations, but still above the 2% target. However, the continuing war in Iran should continue to put upward pressure on energy prices, which tend to work their way into the Core CPI by various means – plastic is made of oil, your plumber or electrician has to put gas in the truck, fertilizer is made with natural gas, etc. Nevertheless, we will call it a small win for now.
The Federal Reserve under new Chairman Kevin Warsh remains understandably cautious, and most analysts believe that further rate cuts are off the table until the Iran situation is resolved. This may put new upward pressure on mortgage rates and auto loans but should also stabilize interest rates on money market funds.
As usual, if you have a sound financial plan and have a high quality, diversified portfolio you should be able to see past the noise and avoid playing the “expectations game” against the market (which is smarter than just about everyone).
Try to stay cool this Summer and we will be back just before the leaves turn in October with the next update. Please contact us if you have any questions.