2022 Q3 Review and Outlook – The “bad news is good news” game, and why bonds still make sense.
Financial markets continued their downward trend in the third quarter as stocks (as measured by the S&P 500 SPDR ETF – SPY) lost 4.9%. The U.S. bond market (as measured by the US Aggregate Bond ETF – AGG) fared a tiny bit better, posting a -4.7% total return, and a 60% stock/40% bond portfolio lost 4.8%. Year to date, stocks lost 24%, bonds were down 14% and a 60/40 portfolio fell 20%.
Figure 1: S&P 500 quarterly performance, trailing four quarters.
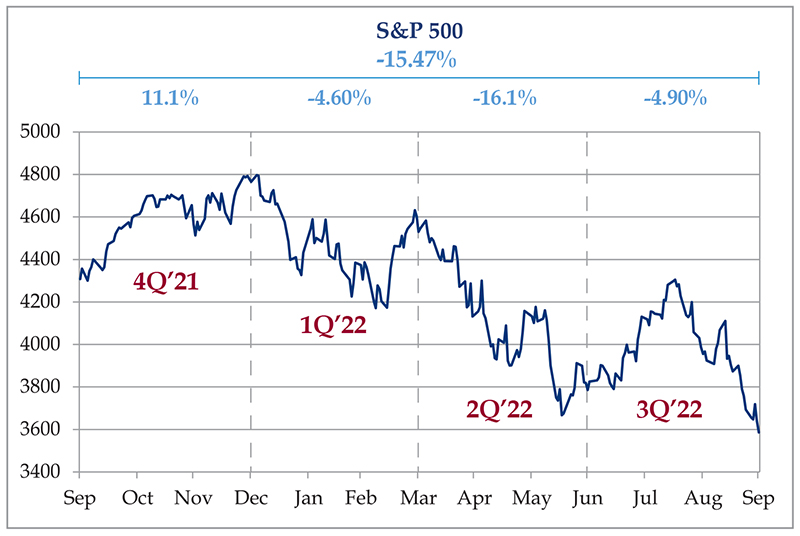
Source: Strategas, Portfolio Visualizer
Inflation – still inflating…
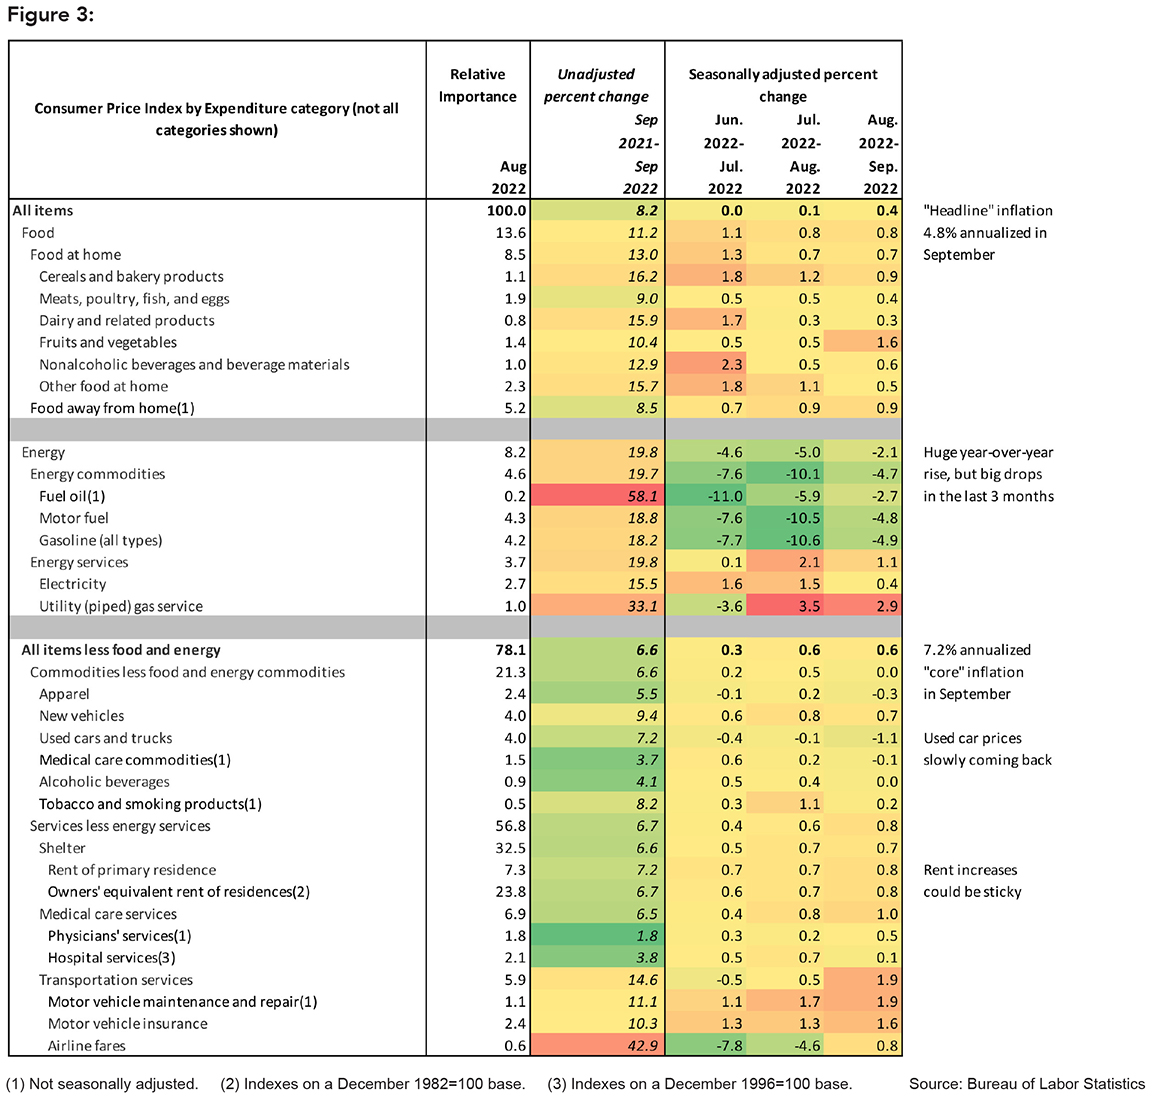
Inflation continues to…inflate. The September CPI report showed an 8.2% year-over-year increase in average prices, which was also higher than most forecasts. Figure 3 provides the latest numbers, and they continue to follow the general trend of the past year or so – a big spike in energy prices combined with higher prices on almost every other category. The year-over-year increase in “Core” prices (i.e., without food & energy) was 6.6%. Although food and energy costs are very important to the average household budget, they are only 22% of the total cost of living index. Plus, the non-food and energy prices are usually less volatile, which can often provide a better view of the underlying trend (which seems to be moderating a bit). However, 6.6% is higher than June’s 5.9% core inflation rate, as items that have been slower to show up in the numbers (e.g., rent) are finally starting to trickle in.
There was nothing in this report to suggest that the current inflation rate will recede any time soon. Although there are signs that transportation costs have slowed significantly (lots of unhappy truckers out there), a lot of different factors need to cool down to fully arrest price growth – many of which aren’t pleasant (e.g., wage growth and unemployment).
…and the stock market loses its mind
Perhaps the most interesting part of the September CPI release (which came out prior to the market open on October 13th) wasn’t the contents of the release, but the wild market reaction to it. Stock index futures plummeted by almost 2% in 30 seconds as traders (in reality, computers trained to read and trade on news releases) digested the higher-than-expected numbers. However, after the stock market open at 9:30am Eastern Time, the stock indexes rebounded and finished 4.4% higher than the opening price and 2.6% higher than the previous day’s closing price. (To put these numbers in perspective, a 1% daily return up or down is considered “high” by historical standards.)
So, a highly anticipated inflation report showed worse than expected results, which in theory would imply a continued hawkish stance from the Federal Reserve, which would then imply an expectation of higher interest rates accompanied by a continued stagnation of economic growth as we enter 2023. In reaction to this wonderful news, the market…jumps for joy and has one of the best open-to-close returns all year???
The short-term traders in the market have become completely wrapped up in the psychology of “bad news is actually good news because the Fed will overreact to this bad news (with much higher interest rate increases) and have to eventually ‘pivot’ and cut rates sooner than expected (because they overreacted and crushed the economy).” Does that make sense? Can anyone explain how this is a coherent basis of an investment strategy?
We do not play this game of “outguess the Fed,” because it’s crazy and unwinnable.
If you are a current client or have been a regular reader of our updates, you probably picked up that we take a long view with investing, as even a 70-year-old client could easily live to 90 – which implies at least a 20-year time horizon. Over those 20 years, what your stock portfolio does in any given day (or week or month) tomorrow is a blip. If you own a group of well-run, growing businesses purchased at decent prices, your stock portfolio will most likely be worth a lot more in 10-15 years, despite the market value rising or falling by as much as 40% in any given year.
The added bonus of taking a long-term view with stocks is that long-term stock returns generally exceed long-term inflation rates by a significant margin. After all, the companies that you own increase prices in response to higher costs. While you hear commercials on TV or the radio selling gold as the ultimate inflation hedge, stocks have been just as good or better over time.
Of course, it’s painful and damaging to your portfolio to have to sell stocks when they are down a lot, so we add in investment grade bonds and also ensure that any large cash expenses needed in the next 12 months belong in…cash. (And, thanks to Powell & Co. at the Federal Reserve, you are finally earning a decent interest rate on your cash!)
About those bonds…
You may have noticed that bond returns continued to be negative this quarter (almost as bad as stocks), and a supposedly “safe” and “low volatility” asset dropping 14% in less than a year rightfully brings up some concerns.
While we explained in general terms why bonds are still a worthy addition to a portfolio in last quarter’s update, we are going to dig a little deeper this quarter and show how bond pricing works and how they can provide long-term stability to a portfolio even in a sharply rising interest rate environment. Class is in session!
The most common type of bond is simply a loan to a company, government or municipality where you get periodic fixed interest payments and all of your principal back at the end of the term. For example, last year the going rate for an A-rated corporate bond was about 2%. Assuming the bond was issued at par, for every $100 an investor lends to the company, they would get $2 per year for the entire term of the bond and then get their $100 back at the end of the term. The investor’s return on this bond would be 2%, regardless if this were a 1 year, a 5 year, a 10 year or a 20 year term. As long as the borrower doesn’t default (a very low probability
with investment-grade bonds) the investor knows exactly what their return will be to the penny (and also knows exactly when they are getting their interest and principal payments). That’s helpful to someone with very specific cash needs.
However, like a 3-year-old child at a birthday party, interest rates don’t sit still. And this movement in interest rates is what causes the value of supposedly “safe” bonds to jump around.
Let’s say you buy a 5-year bond in October 2021 at $100 with a 2% coupon payment, and interest rates jump to 5% a year later (which is exactly what happened in 2022), the value of that bond is going to drop. Why would anyone pay the full $100 for a 2% bond when they can get a 5% bond at the same price? To compensate, the seller of the 2% bond would need to reduce the price to make it just as attractive as the shiny new bond with the much higher coupon payment. How much would the price need to drop? For a 5-year bond (now a 4-year bond since it’s a year later), to about $90, or a 10% “loss.” While it’s true that, if you sell that bond at $90 you will book a loss, if you hold it to maturity, the value will return to $100 no matter how high interest rates rise. That’s because the company or municipality still owes you $100, not $90.
Figure 2 shows how this works. In this example, in 2021 we bought a 2 year, a 5 year and a 10-year bond each at par ($100), at a “yield to maturity” of 2%. In 2022, interest rates jump to about 5% and all the bond values fall – even the short-term bond. Furthermore, interest rates keep rising, until the benchmark rate hits 9.5% in 2031. (This is not a forecast, simply an extreme example.)
Don’t get too caught up in the exact numbers – the key point is the shape of the curves – the value initially drops but is pulled back toward $100 as the bond gets closer to maturity. The return of all three bonds at their maturity dates is exactly 2.000000%. No more, no less.
Figure 2: The value of 2% coupon bonds purchased in 2021 in a rising interest rate environment.
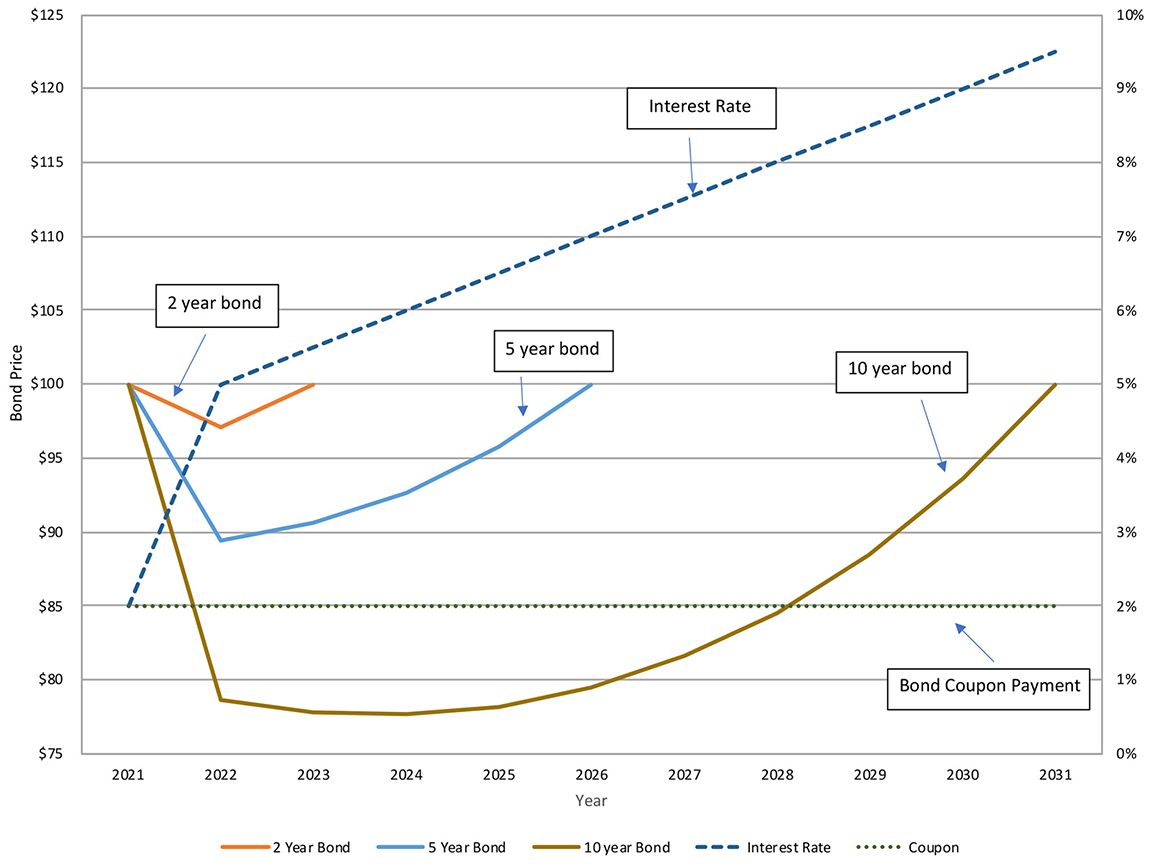
Source: TCV Trust & Wealth Management research
There are a few caveats to this scenario, which is intentionally simplistic. The two biggest concerns are a) “what if I need to sell my bonds early?”; and b) “Why on earth would I buy a 10-year bond when I get the same return from a 2-year bond without the rollercoaster ride?”
While there are no perfect answers (because that would require a 100% accurate view of both the future direction of interest rates and investor cash needs), the most common way to address these concerns is to build a “bond ladder.” You take your bond allocation and divide it equally across your time horizon in years. (We default to 10 years). So, an investor with a $1 million bond portfolio would buy $100,000 worth of 1-year bonds, $100,000 worth of 2 year bonds, all the way to 10 years. This accomplishes two goals: a) the investor knows that they will get $100,000 back every year for 10 years (plus the interest payments); and b) the portfolio doesn’t require any special forecast of interest rates. If rates go up, your longer-term bonds will drop a lot, but you will have the less-affected shorter-term bonds to provide a cushion. Plus, if you don’t need the entire $100,000 that year, you can reinvest the proceeds at the higher rates, which will increase the future return of your bond portfolio. If interest rates fall, you are reinvesting your short-term bonds at lower rates, but you have locked in relatively high rates in your longer-term bonds.
To address the issue of “why not just invest in short-term bonds and avoid the rollercoaster” – the short answer is that most of the time, you get a higher initial rate for a long-term bond than a short-term bond. That isn’t always the case, but it is usually the case. The higher interest rate on long-term bonds compensates you for the rollercoaster ride.
What about bond funds? They never mature!
While a bond ladder sorts out a lot of the major issues with interest rate movements and cash needs, many investors don’t have enough money to build a properly diversified ladder (we recommend a minimum of $500,000 for a 10-year ladder), and it can be tough to sort through the different bonds for sale and figure out which ones to buy. Therefore, a smaller and/or “do it yourself” investor would need to invest in bond funds and/or ETFs. However, the value of these funds rises and falls every day and it never “matures,” which at first glance makes owning a bond fund inferior to owning individual bonds. However, a bond fund is simply a huge bond ladder that continually invests the maturities back into the fund, so the long-term returns of a bond fund will be roughly similar to that of an equivalent bond ladder (along with lower transaction costs, more diversification and much better liquidity). You don’t get that “to the penny” certainty investing in bond funds, but the results should be in the same neighborhood over a long enough holding period (i.e., owning a bond fund for ten years should produce similar returns to a 10 year ladder of the exact same class of bonds).
Hopefully that provides a bit more detail as to why we continue to believe that bonds have a role to play in a portfolio in a period of sharply rising interest rates. Class dismissed! We hope everyone has a safe and enjoyable Autumn and we will be back at the start of the new year with another update.
Figure 3: 2022 Q3 Review and Outlook – Selected Components of the Consumer Price Index (CPI), September 2022